Scan, pay, repeat: Behavioural shift on payment modes drives UPI transactions of over ₹617 trillion in past 102 months
There has been a behavioural shift among Indians regarding payment systems. People, who depended on cash transactions earlier, now prefer to scan a QR code or enter a UPI (Unified Payments Interface) id to make payments on their mobile phones. Launched by the National Payments Corporation of India (NPCI) eight-and-a-half years ago, even small amounts starting from ₹1 are transacted on this ‘Made-In-India’ UPI platform.
Ever wondered what the total amount transacted on UPI since its inception 102 months ago, would be? It is a whopping ₹617.59 trillion from 387.72 billion transactions.
Launched in April 2016, UPI handled a cumulative ₹69.52 billion from 17.86 million transactions during 2016-17. Only 44 banks were live on the platform by the end of that fiscal.
Fast forward to 2023-24. UPI handled around ₹199.86 trillion from 131.16 billion transactions in 2023-24. The amount transacted stood at ₹122.05 trillion from 85.66 billion transactions in the first half of 2024-25, with 622 banks live on the UPI platform.
UPI crossed the ₹1 trillion mark in December 2018, ₹10 trillion mark in May 2022, and ₹20 trillion mark in May 2024.
The volume of transactions has also grown multiple times in the last eight-and-a-half years. From a mere 90,000 transactions in July 2016, it reached 15.04 billion in September 2024. The number of transactions crossed 1 billion in October 2019, and 10 billion in August 2023.
P2P for money, P2M for volume
Though the UPI transaction volume (number of transactions) mirrored the amount transacted for some months, the P2M (person to merchant) category gained traction from September 2022. Now, the P2M category contributes nearly two-thirds of UPI volume. Interestingly, more than 80 per cent of P2M volumes are dominated by transactions below the ₹500 range.
Trends in local businesses clearly highlight this shift. Padmanabha Shetty, the owner of a petty shop on the outskirts of Mangaluru, said the share of cash and UPI payments at his store is nearly equal, and a major chunk of UPI payments are contributed by youth. Echoing this, Sudhakara Poojary, an autorickshaw driver, said youths carry less cash today and prefer to scan the QR code to pay.
The average payment was below ₹100 per transaction for Sudhakara Poojary, and in the range of ₹100-200 for Padmanabha Shetty.
This indicates that though more users are opting for UPI for payment at merchant establishments, the amount transacted remains below ₹500.
App ecosystem
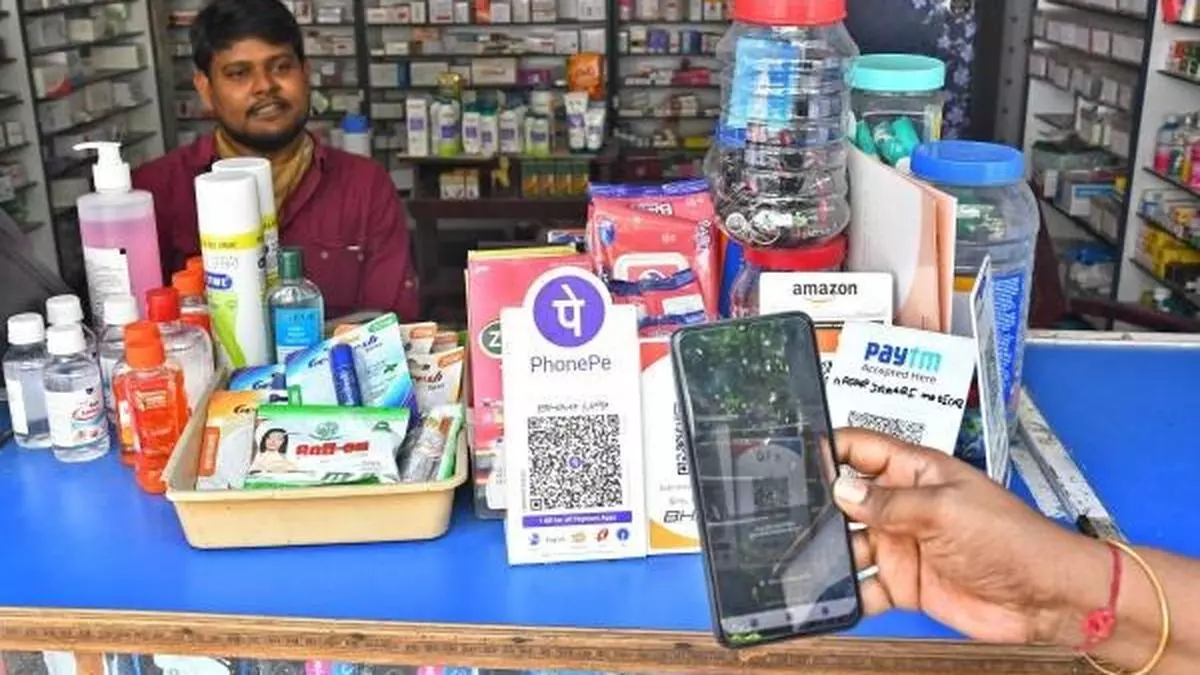
Most of the time, when you scan the QR code at a merchant establishment, you hear the device installed there say: “Received Rs XYZ on ABC”. Usually, “ABC” here refers to a UPI app. NPCI data for the UPI ecosystem, available from April 2020, showed that third-party apps such as PhonePe and GooglePay handled more than 80 per cent, both in terms of the amount of money handled and the volume of transactions.
NPCI’s BHIM app was the primary player when UPI was launched in 2016. However, BHIM’s share in terms of the amount of money handled, which was at around 3 per cent in April 2020, declined to 0.41 per cent in September 2024. The app’s share in volume of transactions has declined from 1.4 per cent in April 2020 to 0.18 in September 2024.
UPI’s growth highlights the shift in payment preference due to its convenience and technological backbone. With millions transacted every single minute, this digital payment landscape is set to become even bigger in the months to come.