Index Outlook 2025: Sensex, Nifty 50 can resume rally
The year 2024 was another good year for the Indian benchmark indices. The Nifty 50 and Sensex surged to new highs before coming down in the final quarter. The indices were up over 8 per cent each for the year. But the Indian benchmark indices underperformed last year compared to their global peers. In the US, the Dow Jones Industrial Average index was up about 14 per cent and Germany’s DAX closed 19 per cent higher for the year. In Asia, Japan’s Nikkei 225 surged 19 per cent and China’s Shanghai Composite index was up about 13 per cent.
Among the sectors in the domestic market, pharma/healthcare and realty outperformed last year. The Nifty Pharma and Nifty Healthcare indices were up about 40 per cent each. The Nifty Realty index rose 34 per cent. The Nifty Media index tumbled 24 per cent in 2024 and was the worst performer among the sectors.
The Sensex and Nifty 50 entered the New Year 2025 on a weak note after witnessing a sharp fall in the final quarter of 2024. The important question that needs an answer now is that how much downside is still left for the indices to find their bottom? Will there be more pain in 2025 or the correction is likely to end, and the uptrend can resume?
Here is our outlook on the major indices for the entire year 2025.
Video Credit: Businessline
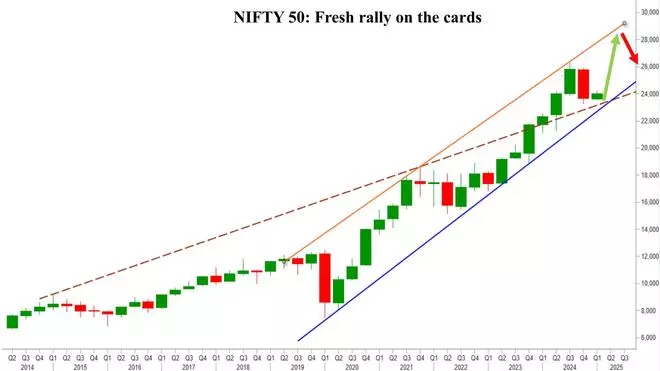
Nifty 50 (24,004.75)
The short-term picture is slightly unclear. Resistance is in the 24,800-25,000 region. Nifty has to breach 25,000 in order to gain momentum and indicate that the fall has ended.
On the downside, supports are at 23,500 and 23,000. We can expect a broad range of 23,000-25,000 for a month or so. As long as the Nifty stays below 25,000, there are chances to see a dip to 23,000-22,500 in the short term.

Chart Source: MetaStock
From a big picture, 23,000-22,500 is a strong support zone. A fall beyond 22,500 is unlikely. We can expect a fresh leg of rally from this support zone which can take the index above 25,000. Nifty can target 28,000-28,500 in the third quarter this year. After this rise, we can get a corrective fall to 26,500-26,000.
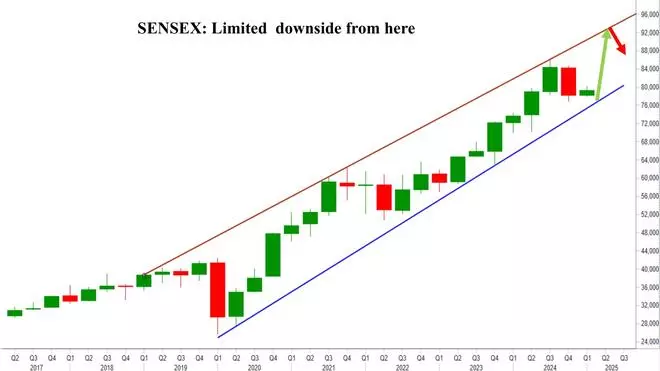
Sensex (79,223.11)
Short-term resistance is in the 82,300-82,500 region. Sensex can remain in broad range of 77,000-82,500 in the short term. A break below 77,000 can take the index down to 76,000-75,500 in the short term.

Chart Source: MetaStock
There is a strong support at 75,350 which is likely to limit the downside. Sensex can see a fresh rise either from 77,000 itself or after a fall to 75,350. That rise will have the potential to take the Sensex up to 92,600 in 2025. A break above 82,500 will strengthen the momentum and trigger the aforementioned rise.
After the rise to 92,600, Sensex can see a corrective all to 88,000.
Nifty Bank (50,988.80)
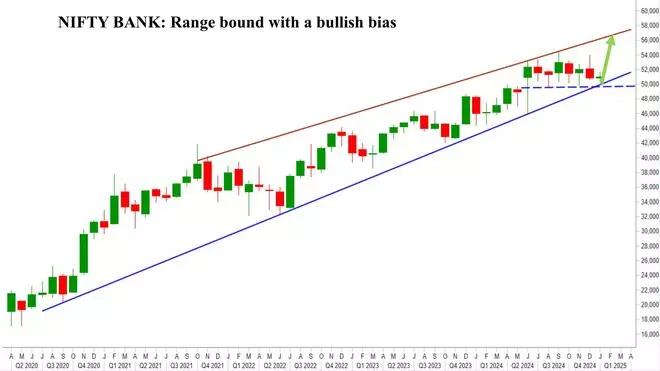
Nifty Bank index has been stuck in a sideways range since July last year. The index has been oscillating between 49,650 and 54,470. This sideways range remains intact. So, Nifty Bank index can continue to trade sideways for some more time. A breakout on either side of this range will determine the next leg of move.

Chart Source: MetaStock
On the charts, the levels of 49,650 and 49,000 are strong supports. A break below 49,000 is less likely. That will need some strong negative trigger. So, looking at the structure on the chart, the bias is positive to see a bullish breakout above 54,470 this year.
Such a break will take the Nifty Bank index up to 56,500 and 57,000 first. An eventual break above 57,000 will then see an extended rise to 58,950 this year.
From 58,950 we can get a corrective fall to 54,000. From a much longer timeframe, of say, more than one year, the Nifty Bank index has potential to target 61,000 on the upside.
Dow Jones (42,732.13)
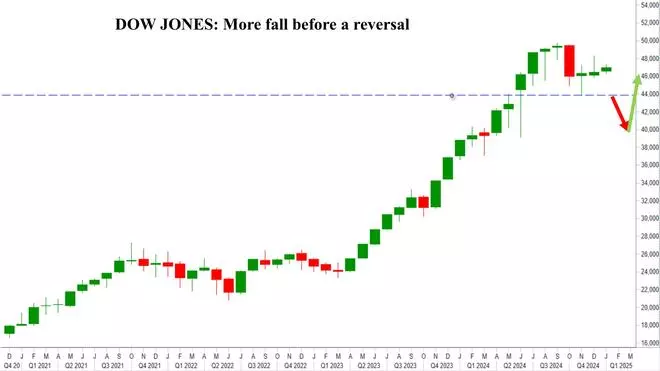
The Dow Jones Industrial Average surged for the second consecutive year. It touched a new high of 45,073.63 in December and has come down sharply from there. An immediate and strong support is around 41,500 which can be tested in the first quarter this year. A bounce thereafter will need a close watch.

Chart Source: MetaStock
If the bounce from around 41,500 fails to breach 43,000-43,500 and reverses lower, that will be very bearish. In this case, the Dow Jones will come under the danger of breaking the 41,500-mark and falling to 39,000-38,000.
From a long-term perspective, such a fall to 39,000-38,000, if seen, will be a very good buying opportunity.
On the other hand, if the Dow Jones manages to breach 43,500 during its bounce from 41,500, then it can rise to revisit 45,000 levels. In this case, a sideways consolidation between 41,500 and 45,000 is a possibility for a few months. Thereafter the range breakout will determine the next direction of move.
Looking at the short-term charts, a rise above 43,500 looks less probable. So, we may have to allow for a steep fall to 39,000-38,000 on the Dow Jones. However, as aforementioned, this fall will give a very good buying opportunity to enter into the US markets.
