Index Outlook: Sensex, Nifty 50: Sideways Consolidation Possible
Contrary to our expectation to extend the fall, the Indian benchmark indices witnessed a strong bounce back last week. Nifty 50 and the Nifty Bank index had closed over 2 per cent. Sensex was up 1.96 per cent. However, on Friday, the benchmark indices had come down sharply from their intraday highs. This leaves a doubt on the strength of the bounce witnessed last week. It also keeps the indices vulnerable for a fall again. As such, we prefer to remain cautious at the moment rather than being overly bullish.
Among the sectors, the BSE Oil & Gas and BSE PSU indices outperformed by surging 9.47 per cent and 8.23 per cent respectively. The BSE Capital Goods index, down 1.46 per cent, underperformed last week.
Watch the FPIs
After selling a massive $3.4 billion in two weeks, the foreign portfolio investors (FPIs) were net buyers of Indian equities last week. The equity segment saw an inflow of $125 million last week. It is important to see if the FPIs are accelerating their purchase from here. That will determine whether the Sensex and Nifty can sustain last week’s bounce or not. So the FPI action in the coming weeks is going to be very important to watch.
Nifty 50 (21,853.80)
Nifty began the week on a positive note by rising above the resistance at 21,600 on Monday itself. We had expected the Nifty to remain below 21,600 and fall last week. After staying stable for the next few days, the index surged to a new high of 22,126.80 on Friday before coming off from there. It has closed the week at 21,853.80, up 2.35 per cent.
Short-term view: The outlook is slightly mixed. Support is around 21,200. Resistance is at 22,150. We can expect the Nifty to oscillate in a range of 21,180-22,150 in the near term. A breakout on either side of this range will then determine the next move.
A break above 22,150 will be bullish. It can take the Nifty up to 22,500 and 22,750 over the next couple of weeks. On the other hand, a strong break below 21,180 can increase the downside pressure. Such a break can drag the Nifty down to 20,700.
Chart Source: MetaStock
Medium-term view: As mentioned last week, 20,700-20,500 is a very crucial support zone. As long as the Nifty stays above this support zone, there are chances to see a rise to 23,300-23,500 in the next few months. But, thereafter, a strong correction is possible. So, as the rally extends beyond 23,000, more caution is needed rather than becoming overly bullish.
On the other hand, the view will turn negative if the Nifty declines below 20,500. In that case, a fall to 20,000 and even 19,500 can be seen. However, from a long-term perspective, such a fall will be a very good buying opportunity. We reiterate that one has to start looking the market from the buy side as the Nifty falls below 20,000 and approaches 19,500 rather than becoming more bearish.
Nifty Bank (45,970.95)
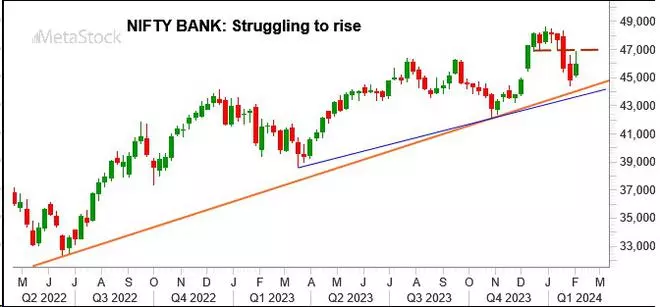
Contrary to our expectation, the Nifty Bank index rose breaking above the resistance at 45,350 last week. The index touched a high of 46,892.35 and had come-off sharply from there. It has closed the week at 45,970.95, up 2.46 per cent.
Short-term view: The price action on the daily chart indicates a strong resistance around 47,100. Nifty Bank index has to break this resistance to become bullish convincingly. Only in that case, the index can rise towards 48,000. A further break above 48,000 can take the Nifty Bank index up to 49,000. This is the bullish case.
But if the index fails to rise past 47,100, it can remain vulnerable for a fall. Intermediate support is around 45,400. Break below it can drag the Nifty Bank index down to 44,800 first and then 44,200-43,800 eventually thereafter.

Chart Source: MetaStock
Medium-term view: The big picture is bullish. As mentioned last week, 43,600-43,400 is a strong support zone that can limit the downside. So, the above mentioned fall to 44,200-43,800 will give a very good buying opportunity from a long-term perspective.
As long as the Nifty Bank index stays above 43,600-43,400, the outlook is bullish to see a rise to 46,000-46,300 initially and then 49,500-50,000 eventually in the coming months.
Sensex (72,085.63)
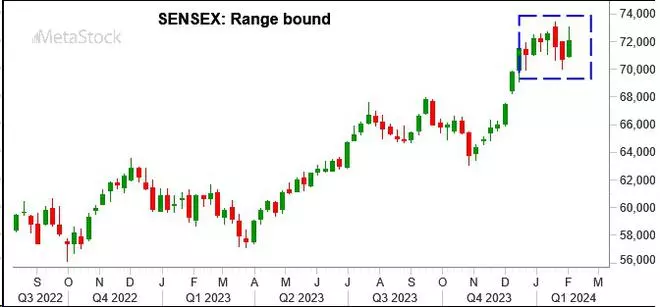
Sensex has risen breaking above its 71,000-71,500 resistance last week. We had expected this resistance to hold and the index to fall. That view has gone wrong. Sensex surged to a high of 73,089.40 on Friday before closing at 72,085.63, up 1.96 per cent.
Short-term view: The near-term outlook is mixed. The broad range of trade could be 70,000-73,400. A breakout on either side of this range will determine the next move.
A break above 73,400 can take the Sensex up to 74,800 or 75,100. On the other hand, a break below 70,000 can drag the index down to 69,500 or 68,900.

Chart Source: MetaStock
Medium-term view: As mentioned last week, 69,000-68,850 is a crucial support zone. A break below it can drag the Sensex down to 67,300 or 66,500 and even lower in the coming months,
But a bounce from around 68,850 can give a breather and take the Sensex up to 70,000. That, in turn, could bring back the bullishness into the market. We will have to wait and watch.
Dow Jones (38,654.42)
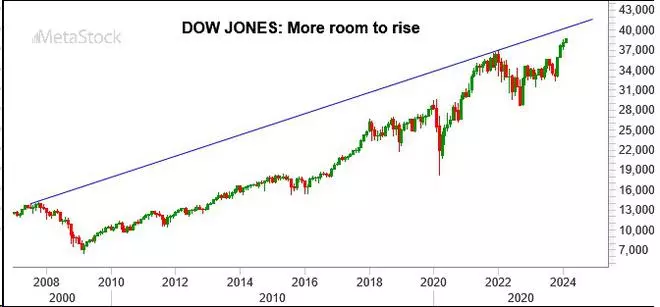
The rise to 38,400 has happened in line with our expectation. The Dow Jones Industrial Average has closed on a strong note at 38,654.42, up 1.43 per cent for the week.

Chart Source: MetaStock
Outlook: The outlook is bullish. Immediate support is around 38,500. The price action on the daily chart last week indicates a strong support formation around 38,100. So as long as the Dow remains above these supports, the chances are high to see a rise to 39,300-39,400 in the next few weeks.
The price action, thereafter, will need a very close watch. A decisive break above 39,400 will see an extended rise to 40,400. But a turnaround from 39,400 can be a trigger for a strong correction. In that case, the Dow Jones will become vulnerable for a fall to 37,000 and even 36,000.
So, for now we will allow for a rise up to 39,300-39,400 and then watch the price action closely.
